Your Bean Probe Has Been Lying to You
The two biggest perks of my job as a consultant have been meeting an extraordinary number of lovely coffee people and getting to use an incredible number of roasting machines. I haven’t kept track, but I estimate I’ve roasted on at least 150 machines. Using so many machines has yielded some surprising benefits, among them learning how easy it is to be fooled by bean-probe data. When a roaster has used only one machine, it’s difficult for him or her to know when it’s appropriate to generalize findings. For example, let’s say on your machine that the turn occurs around 1:30 and 85℃ (185℉) on all good batches. Is that a significant finding worth applying to other machines? As it turns out, not at all.
Leaving aside the fact that the turn doesn’t really exist (see pages 20 & 30 of The Coffee Roaster’s Companion), not only do different machines, batch sizes, charge temperatures, etc., influence the time and temperature of the turn, the speed and diameter of the bean probe does, too.
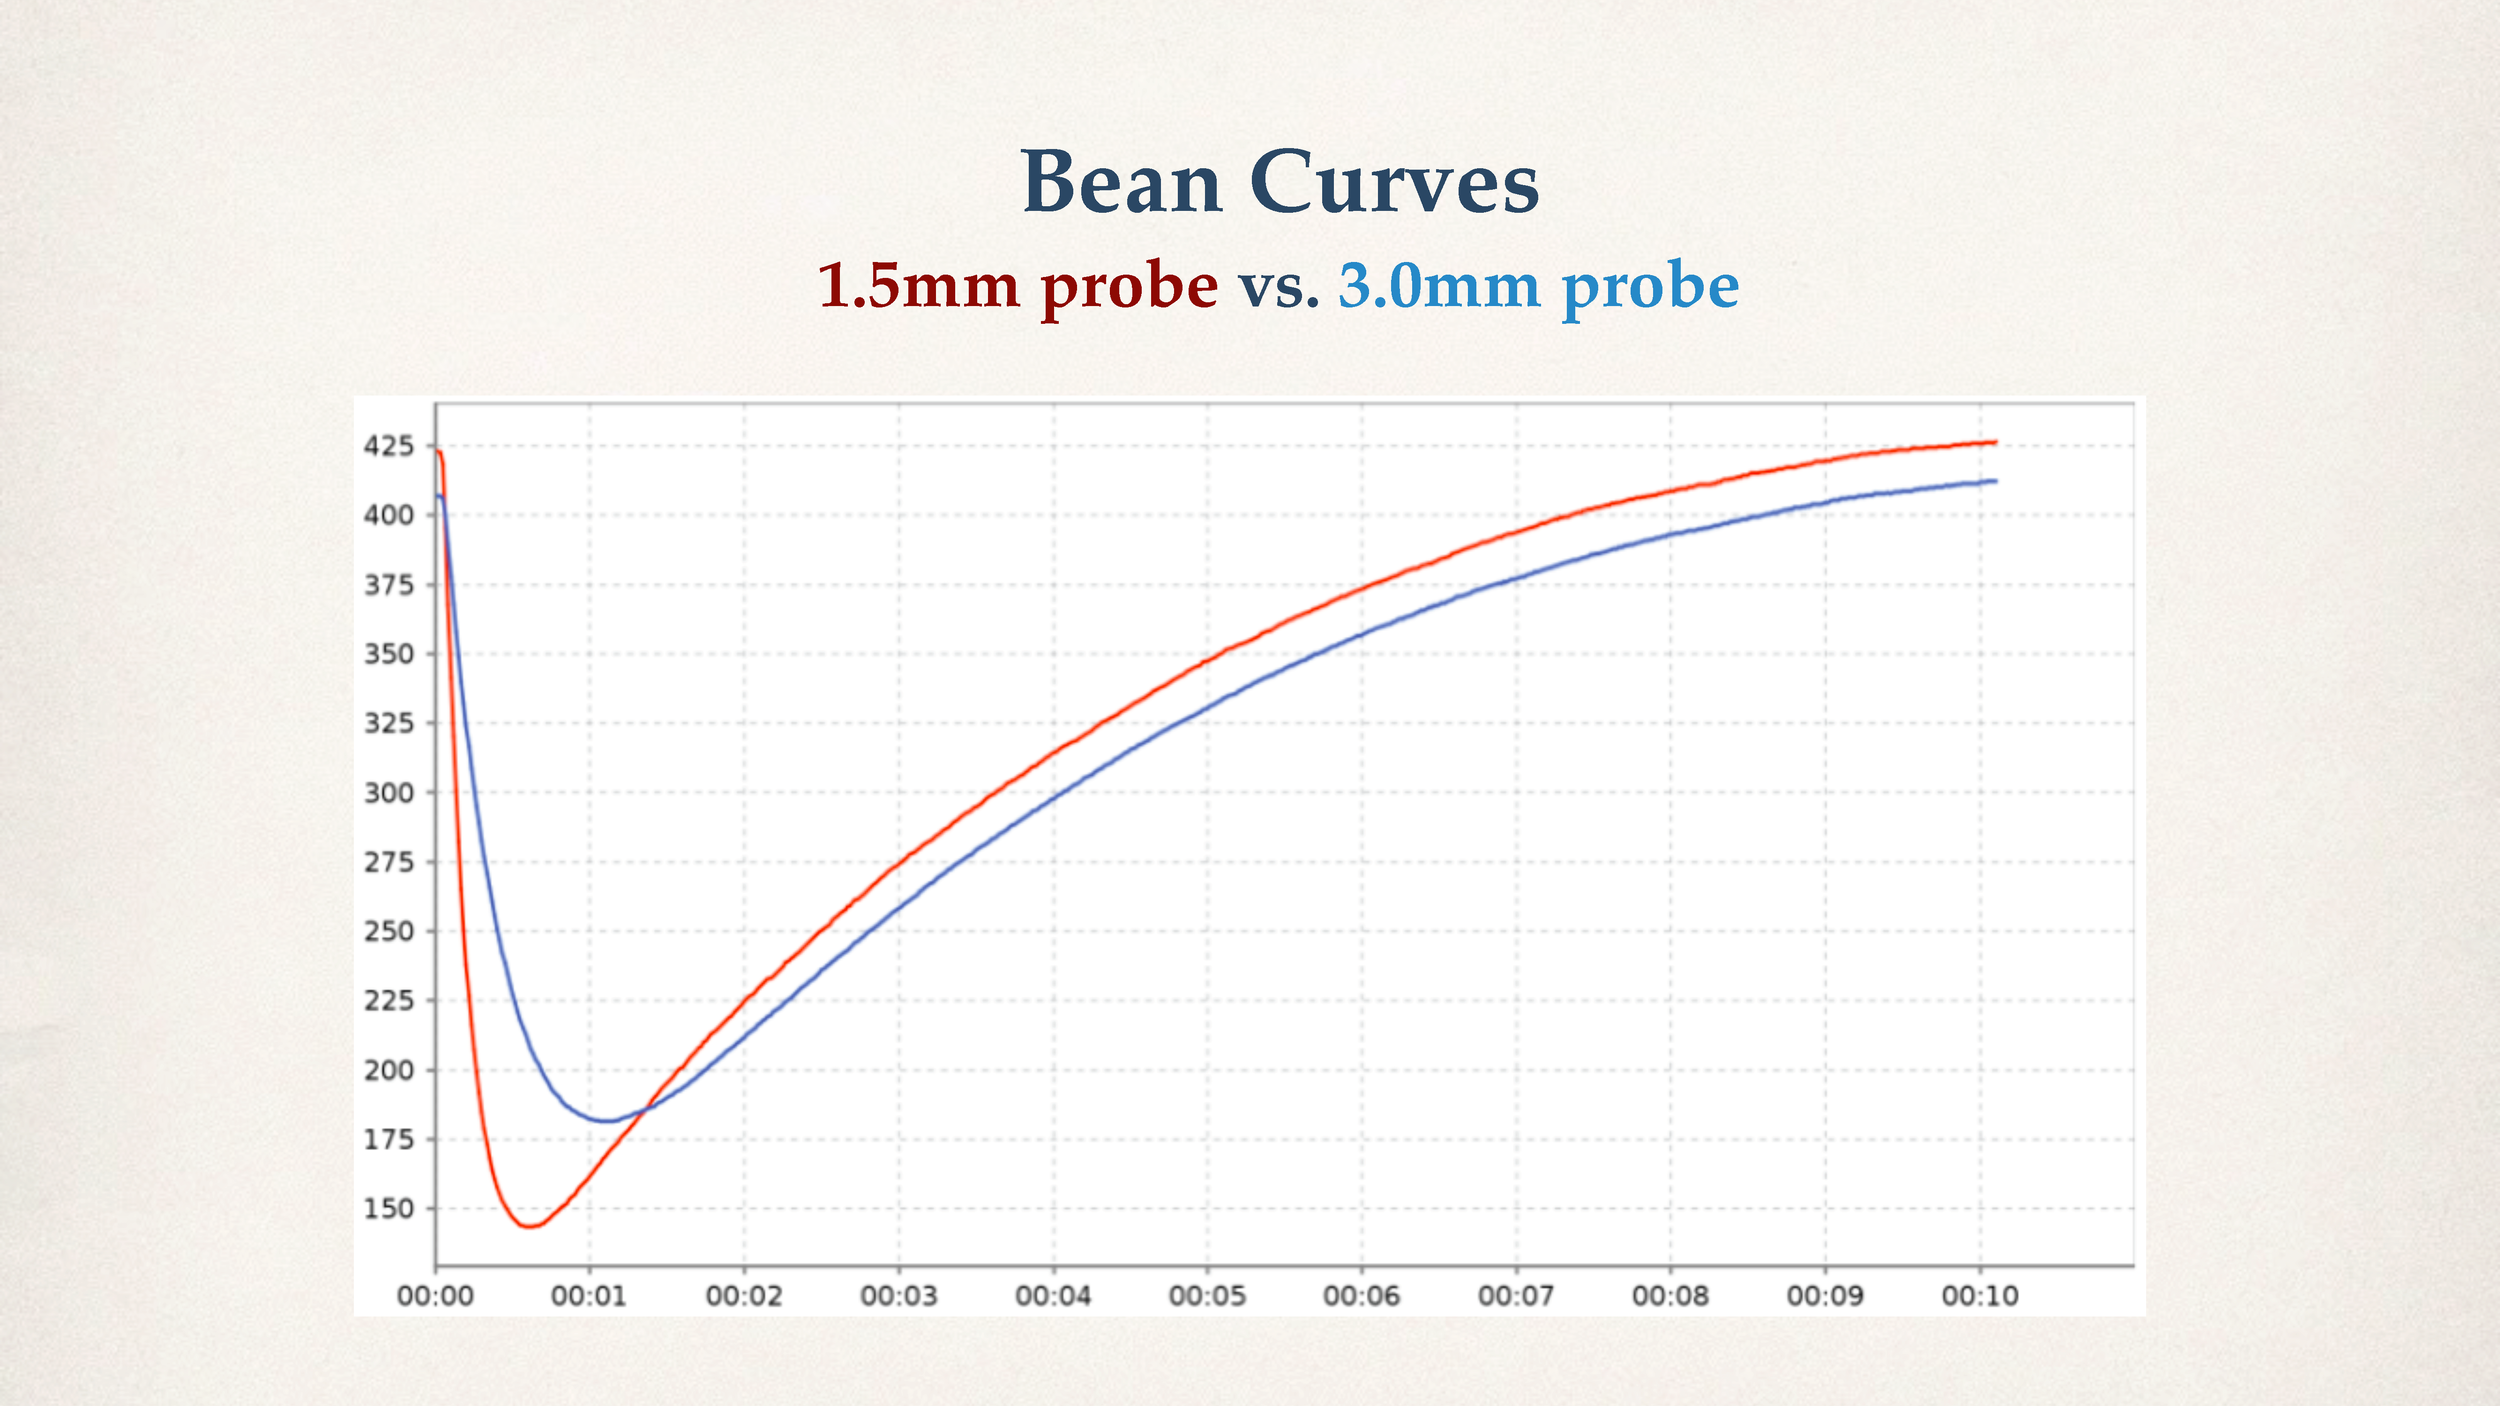
Below is a graph of an experiment done by my client Tim Burstow of Sleepless City Roasters in Toowoomba, Australia (I love Australian town names!). I had mentioned the effect of bean-probe diameter on roast curves to Tim and he immediately installed a 1.5-mm next to his 3.0-mm probe, hooked them both up to Cropster, and sent me this curve.
Please note that these are both very thin probes. Had Tim installed a 5-mm probe instead, it would likely have made the turn appear above 200℉ (93℃) and well after 2:00. Some larger roasters have 10mm-diameter probes; such large probes make the turn occur even later and hotter.
So, does the turn matter? Yes; like most bean-temperature data, it matters in terms of maintaining internal consistency and finding what works for your machine, probe, coffee, and batch size. But if you buy a different machine or even a larger version of the same machine, all bean-temperature data needs to be reassessed.
One question I get asked too often is “at what temperature should my ROR peak?” Returning to Tim’s probes, the graph below shows the same roast’s ROR curves, generated by the two probes:
Given that, again, these two curves represent the same roast batch, the answer is, of course, that there is no way to generalize about an ideal peak ROR. Similar caveats exist about generalizing final bean temperature, charge temperature, environmental temperatures, etc.
Here’s an example of a curve tracked by a 5-mm probe (my apologies for the different formats and switching between ℉ and ℃):
The top graph represents the bean curve and the bottom shows the ROR curve. (Please ignore the blue curves.) Note how the turn occurred at 2:00 and 115℃ (239℉), and the ROR did not peak until after 4:00.
This problem of different probes presenting such different numbers is why I focused on ratios and rules of thumb in CRC, and avoided too many prescriptive numbers. For example, a recommendation to aim for a certain DTR, roast time, or general roast-curve shape (i.e., avoid a crash or a flick) is useful to apply to almost any machine and probe, assuming one understands the context in which the recommendation is made.
Is there a way around these bean-data problems? Perhaps. If every roaster used the same bean probe, it would make roast data across different machines more similar, but still not identical. The best solution would probably involve remote sensing of bean color or surface temperature using some kind of laser or infrared technology. For example, ColorTrack offers a promising laser “RealTime” color-reading system that seems promising.
The air temperature surrounding a bean probe and the proportion of the probe’s surface in contact with beans vs. air heavily influence data from the probe. A system like ColorTrack’s has the potential to not only get around the influence of air temperature, but also to allow the industry to finally have a universal standard for discussing bean color or temperature during roasting.


